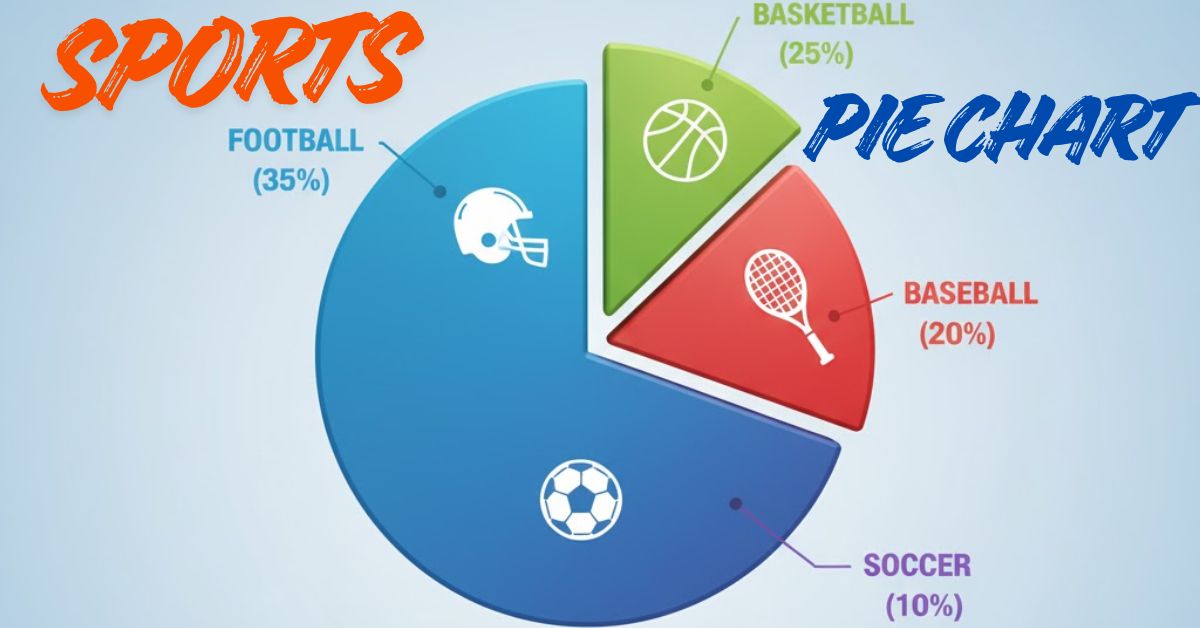
A pie chart shows favorite sports: Football 40%, Cricket 30%, Tennis 20%, Basketball 10%. What is the largest segment?
Cricket
Tennis
Football
Basketball
If 200 students were surveyed, and 25% liked cricket, how many liked cricket?
25
50
75
100
In a 360° pie chart, 72° represents swimming. What percent of total students like swimming?
10%
15%
20%
25%
A pie chart shows basketball 90°, cricket 120°, football 150°. Which is most preferred?
Cricket
Football
Basketball
All equal
If 25% of students prefer badminton, and total is 160 students, how many prefer badminton?
30
35
40
45
A pie chart shows football and cricket covering 240° together. What percent of players like these two sports?
50%
60%
66.7%
75%
Out of 600 players, 25% play cricket. How many play cricket?
100
120
150
200
A sports survey shows: Cricket 150°, Football 120°, Others 90°. What is the least popular category?
Cricket
Football
Others
Equal
In a pie chart, 180° represents football fans. What percent does it represent?
25%
40%
50%
75%
A school’s sports interest pie chart shows: Cricket 144°, Football 72°, Hockey 90°, Athletics 54°. Which is most popular?
Cricket
Football
Hockey
Athletics